BBox Detection Results Analysis Dashboard
Generated on: 2025-08-07 19:29:35
paligemma2_3b_mix_448_detect_locations Analysis
Overview Metrics
COCO AP (IoU 0.5:0.95)
0.205
AP50 (IoU 0.5)
0.307
AP75 (IoU 0.75)
0.218
Avg Time/Image
4.49s
Additional Metrics
Total Categories
80
Total Images
5000
Visualizations
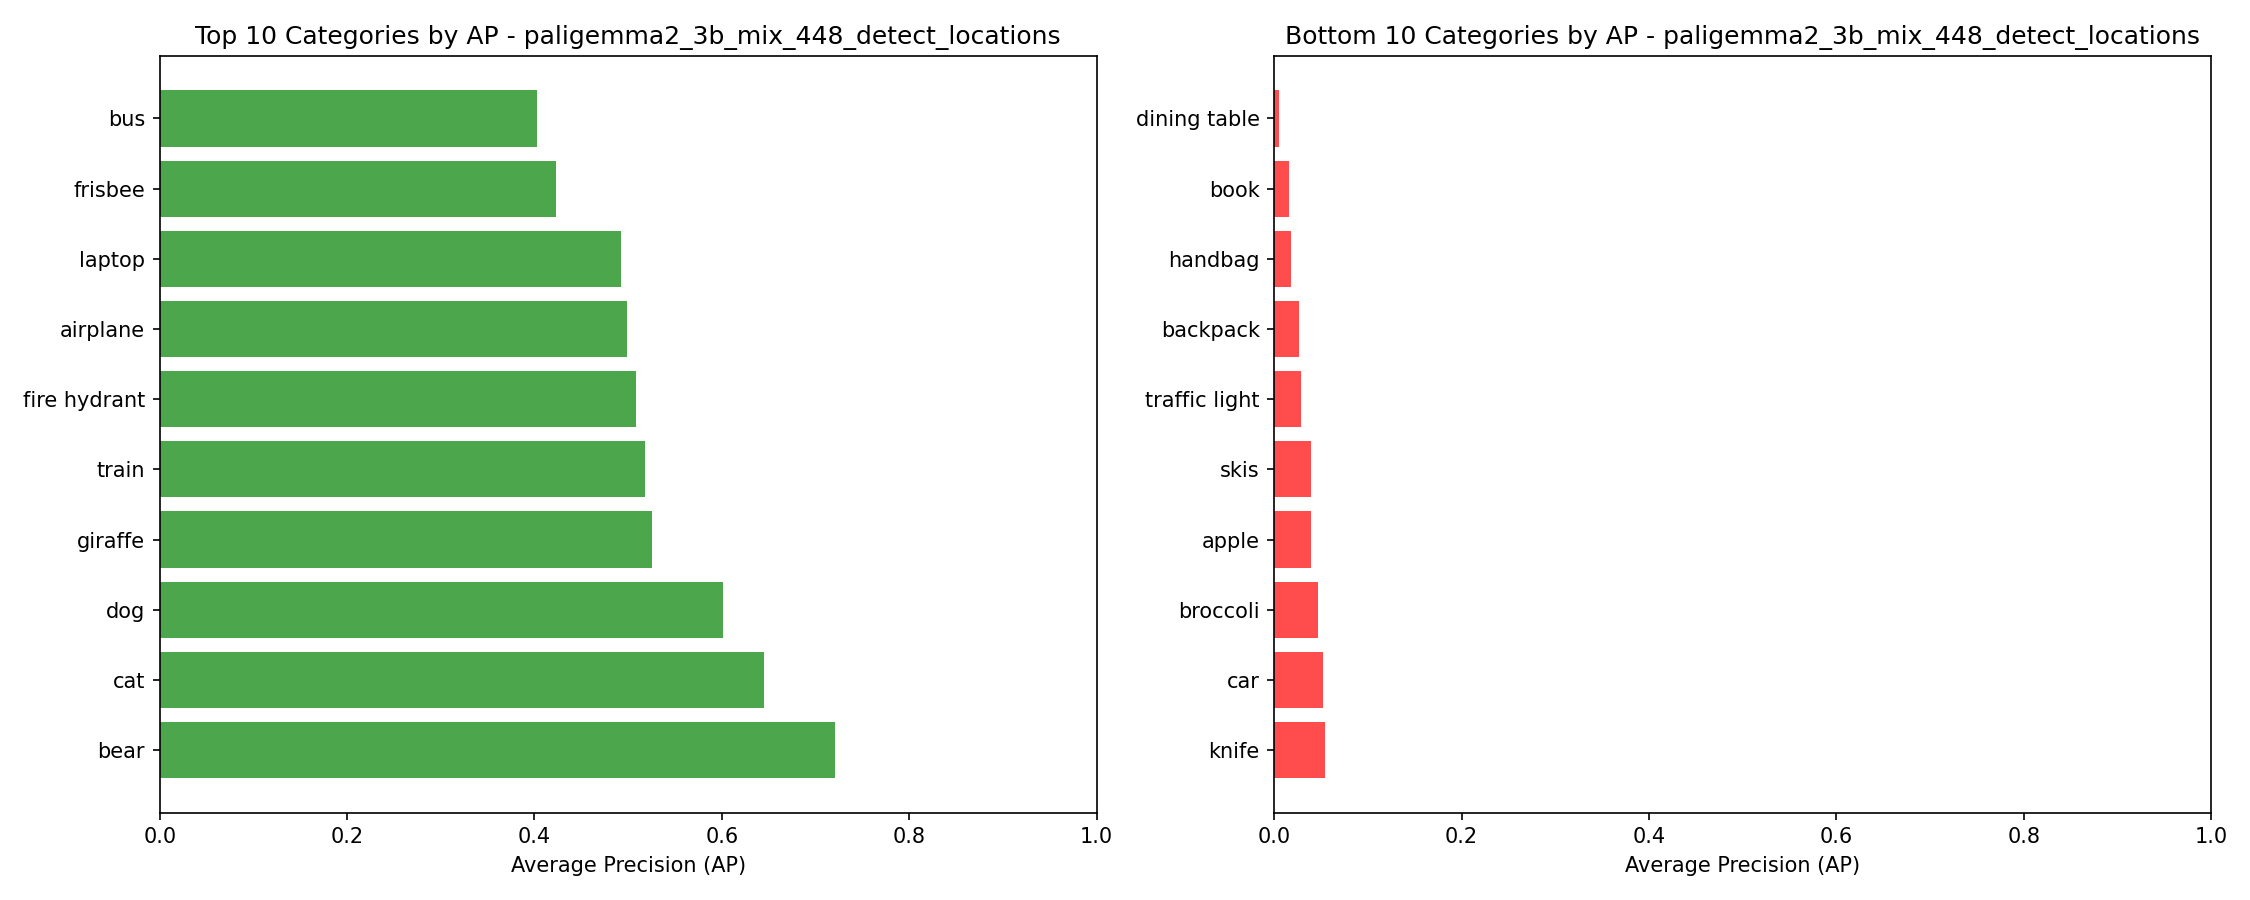
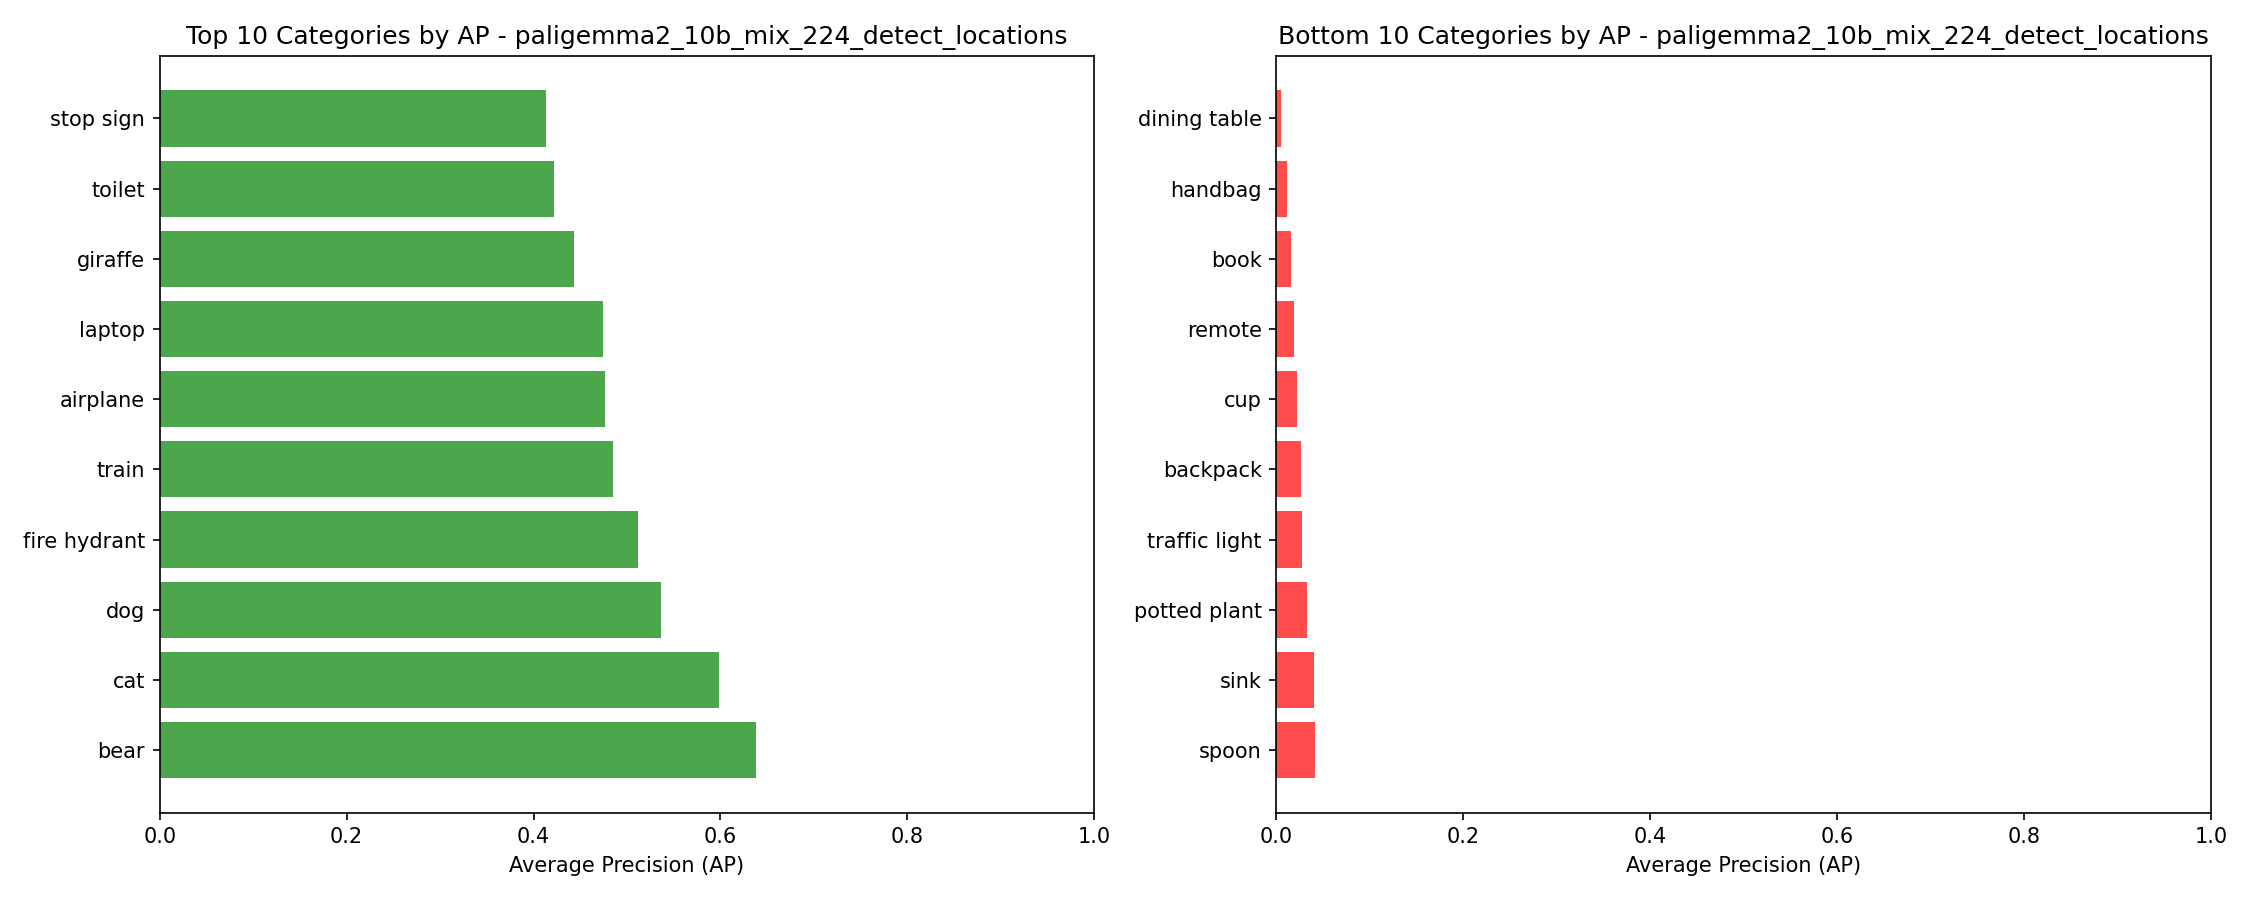
Top Performing Categories (by AP)
| Category | Average Precision |
|---|---|
| bear | 0.721 |
| cat | 0.645 |
| dog | 0.601 |
| giraffe | 0.525 |
| train | 0.518 |
| fire hydrant | 0.508 |
| airplane | 0.498 |
| laptop | 0.492 |
| frisbee | 0.423 |
| bus | 0.403 |
Bottom Performing Categories (by AP)
| Category | Average Precision |
|---|---|
| knife | 0.054 |
| car | 0.052 |
| broccoli | 0.047 |
| apple | 0.039 |
| skis | 0.039 |
| traffic light | 0.029 |
| backpack | 0.027 |
| handbag | 0.017 |
| book | 0.016 |
| dining table | 0.005 |
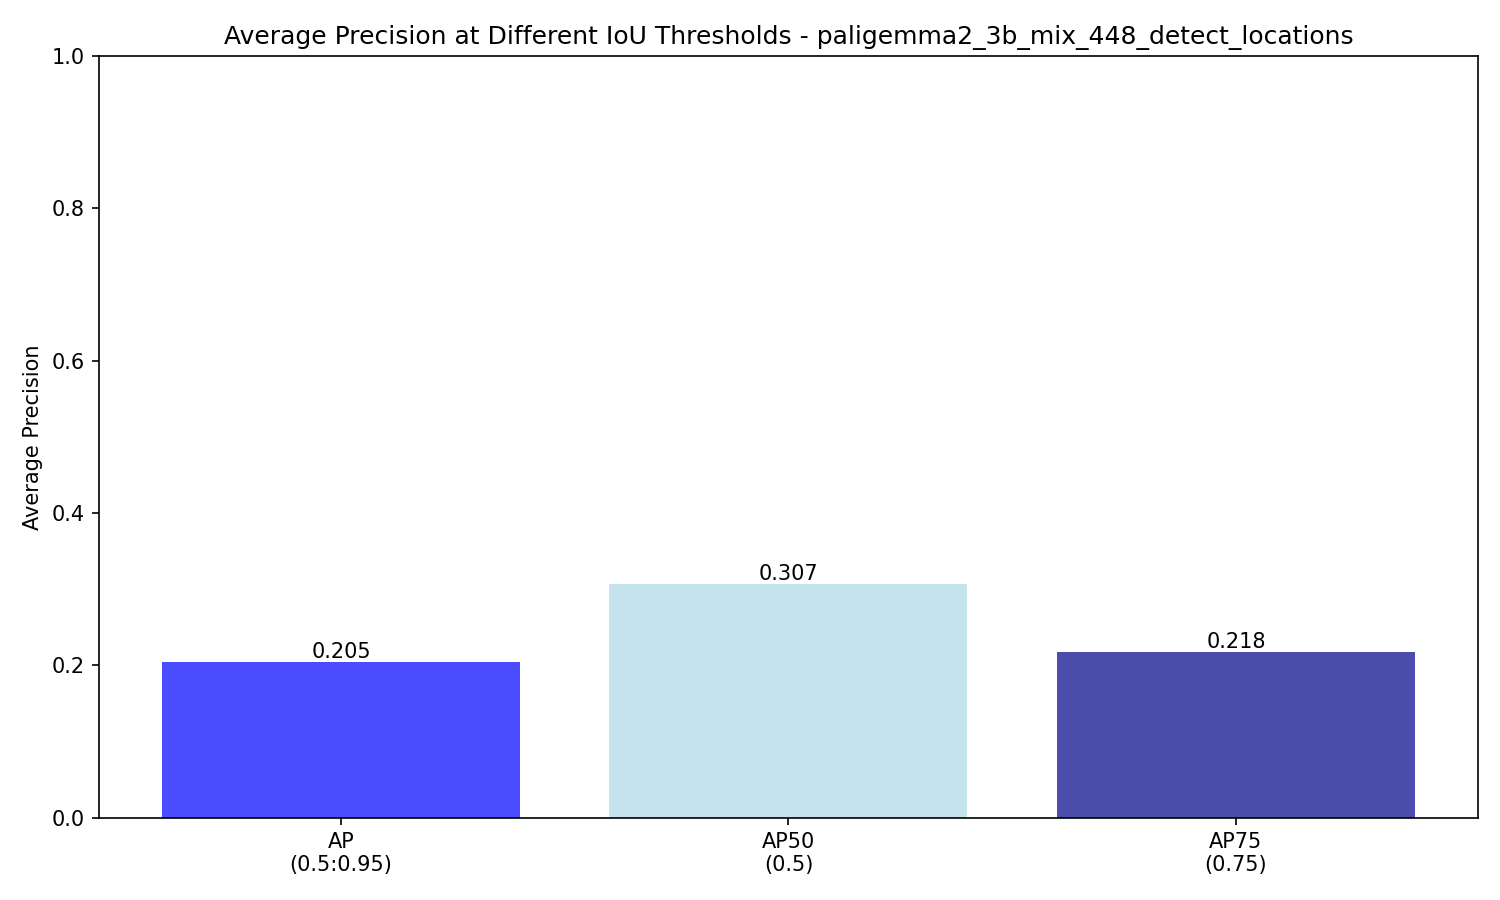
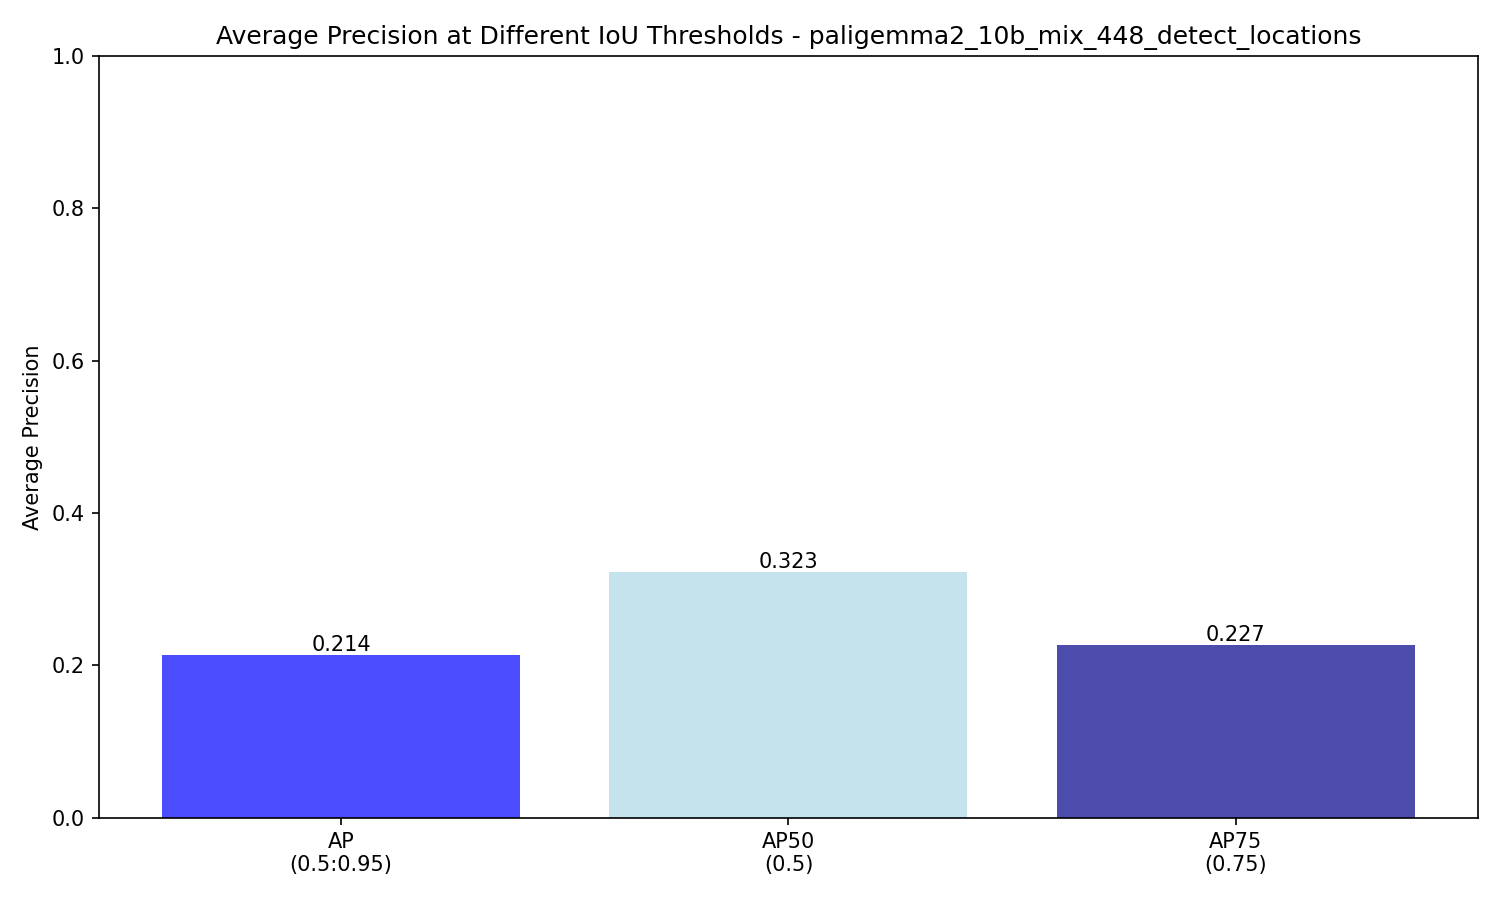
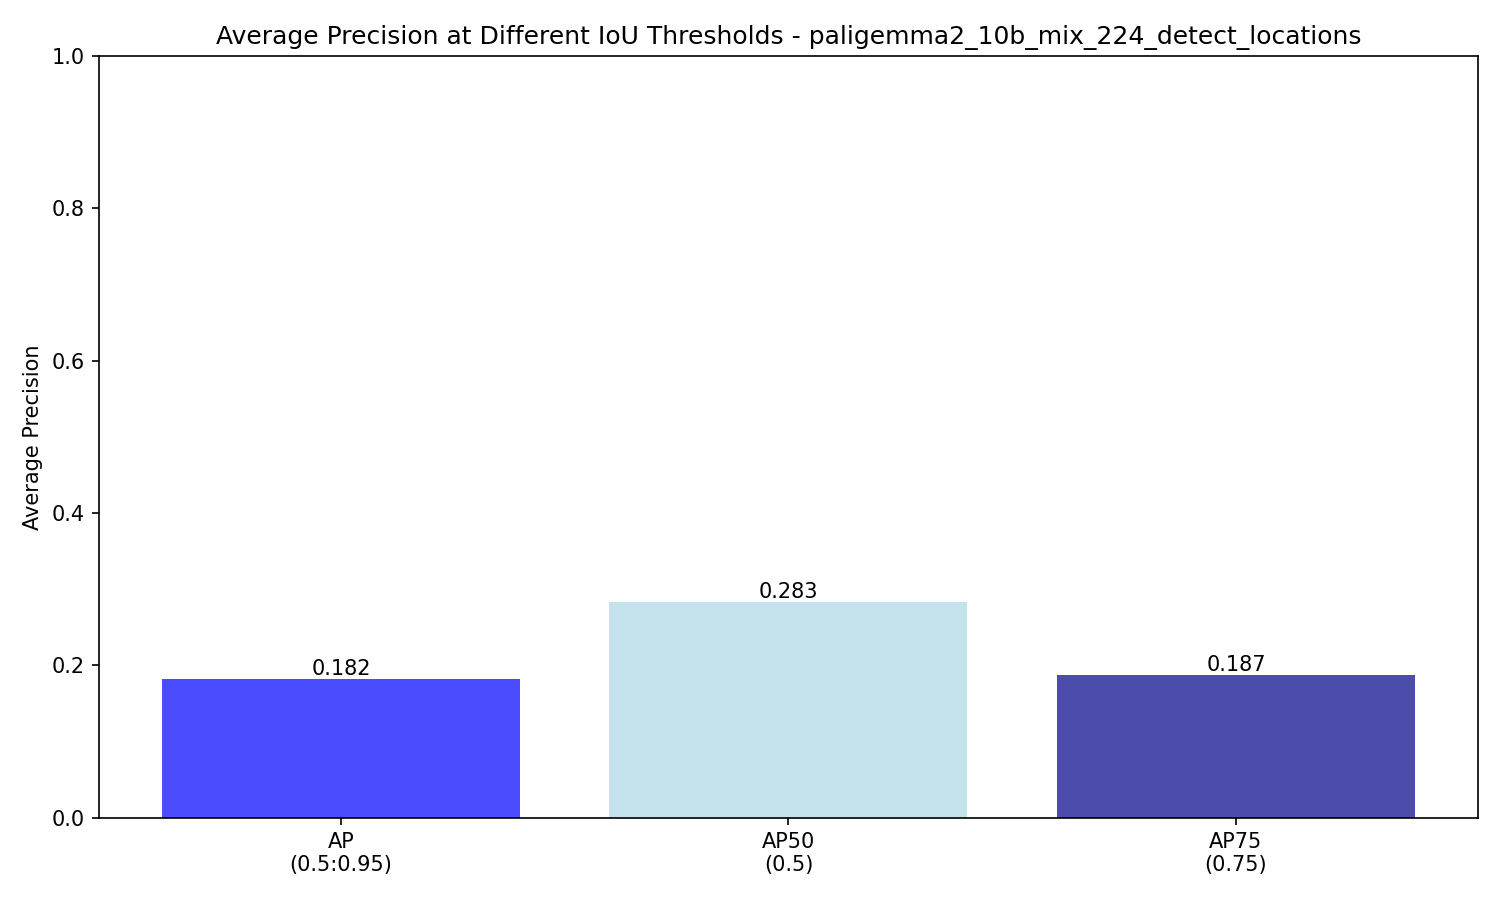
IoU Threshold Impact
The IoU (Intersection over Union) threshold determines how strict the evaluation is. Higher thresholds require more precise bounding box alignment with ground truth.
| Metric | IoU Threshold | Value |
|---|---|---|
| AP | 0.50:0.95 (averaged) | 0.205 |
| AP50 | 0.50 | 0.307 |
| AP75 | 0.75 | 0.218 |
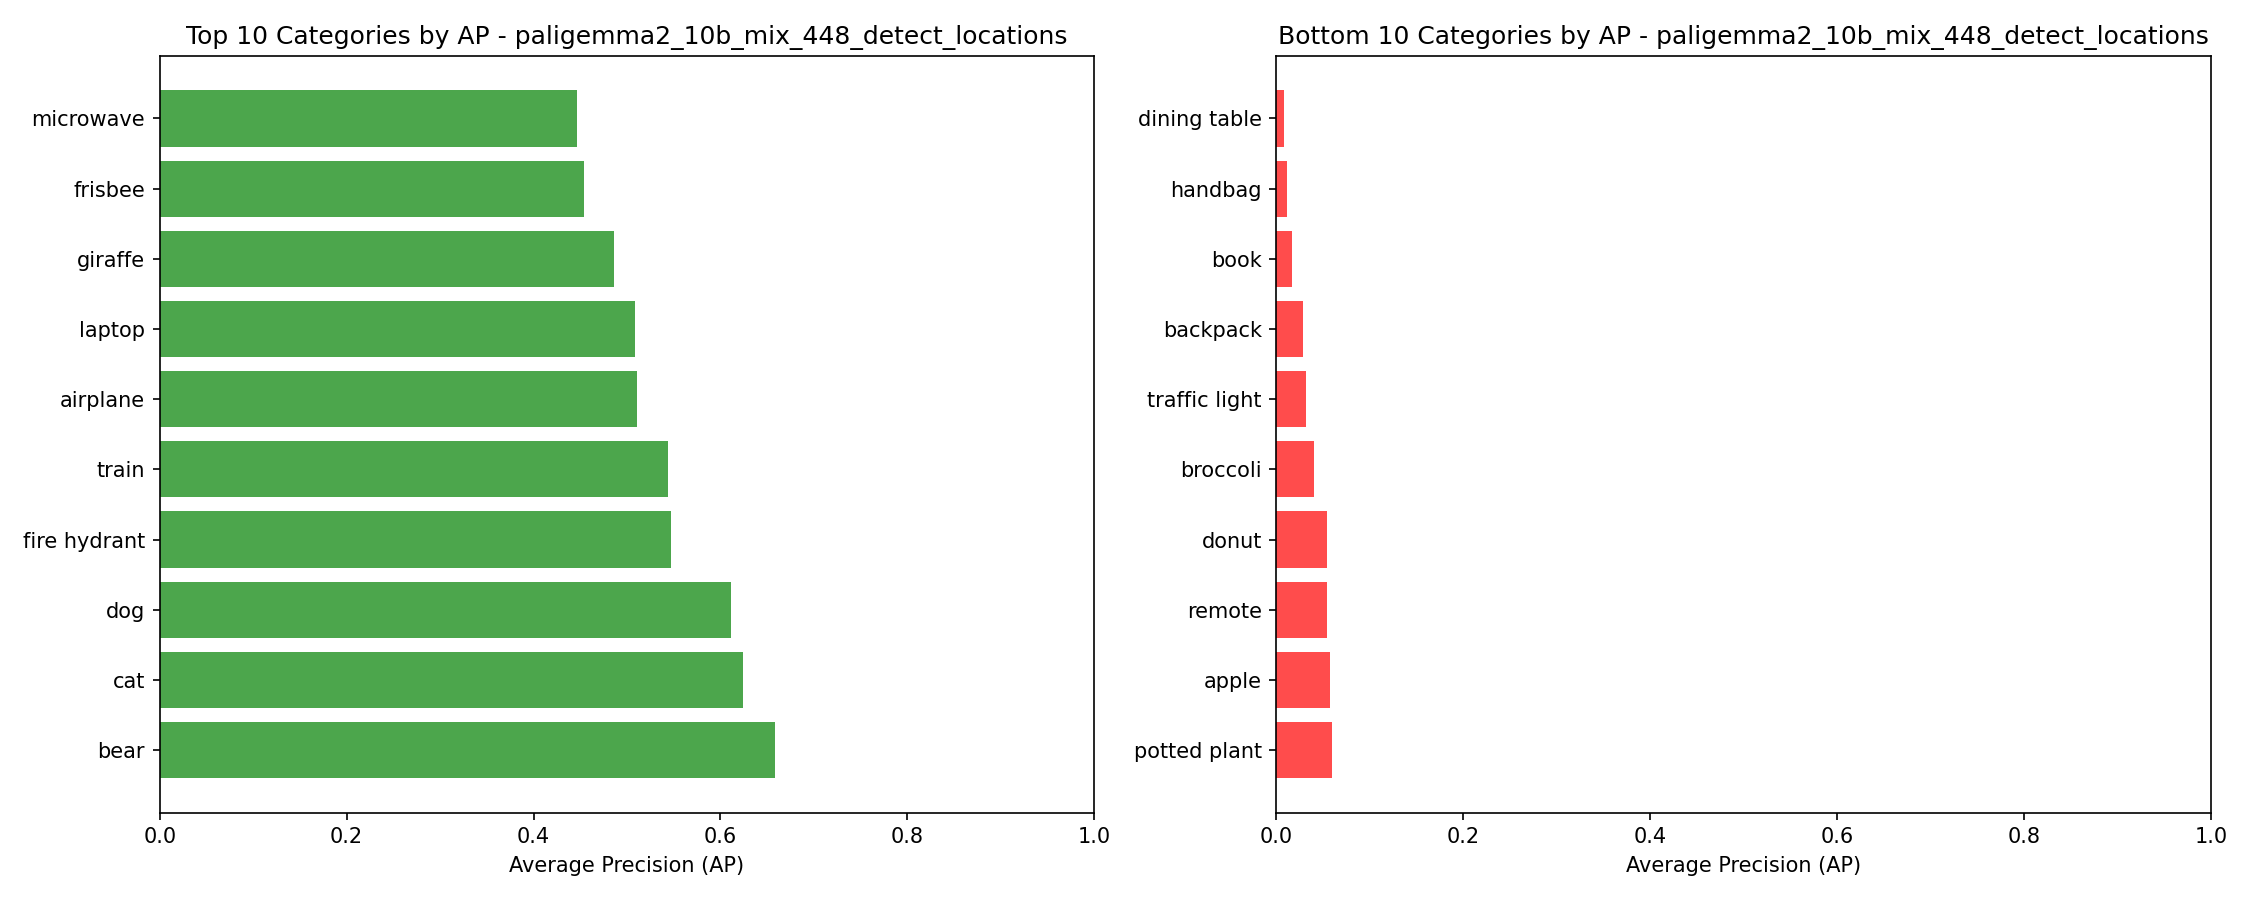
Model Comparison
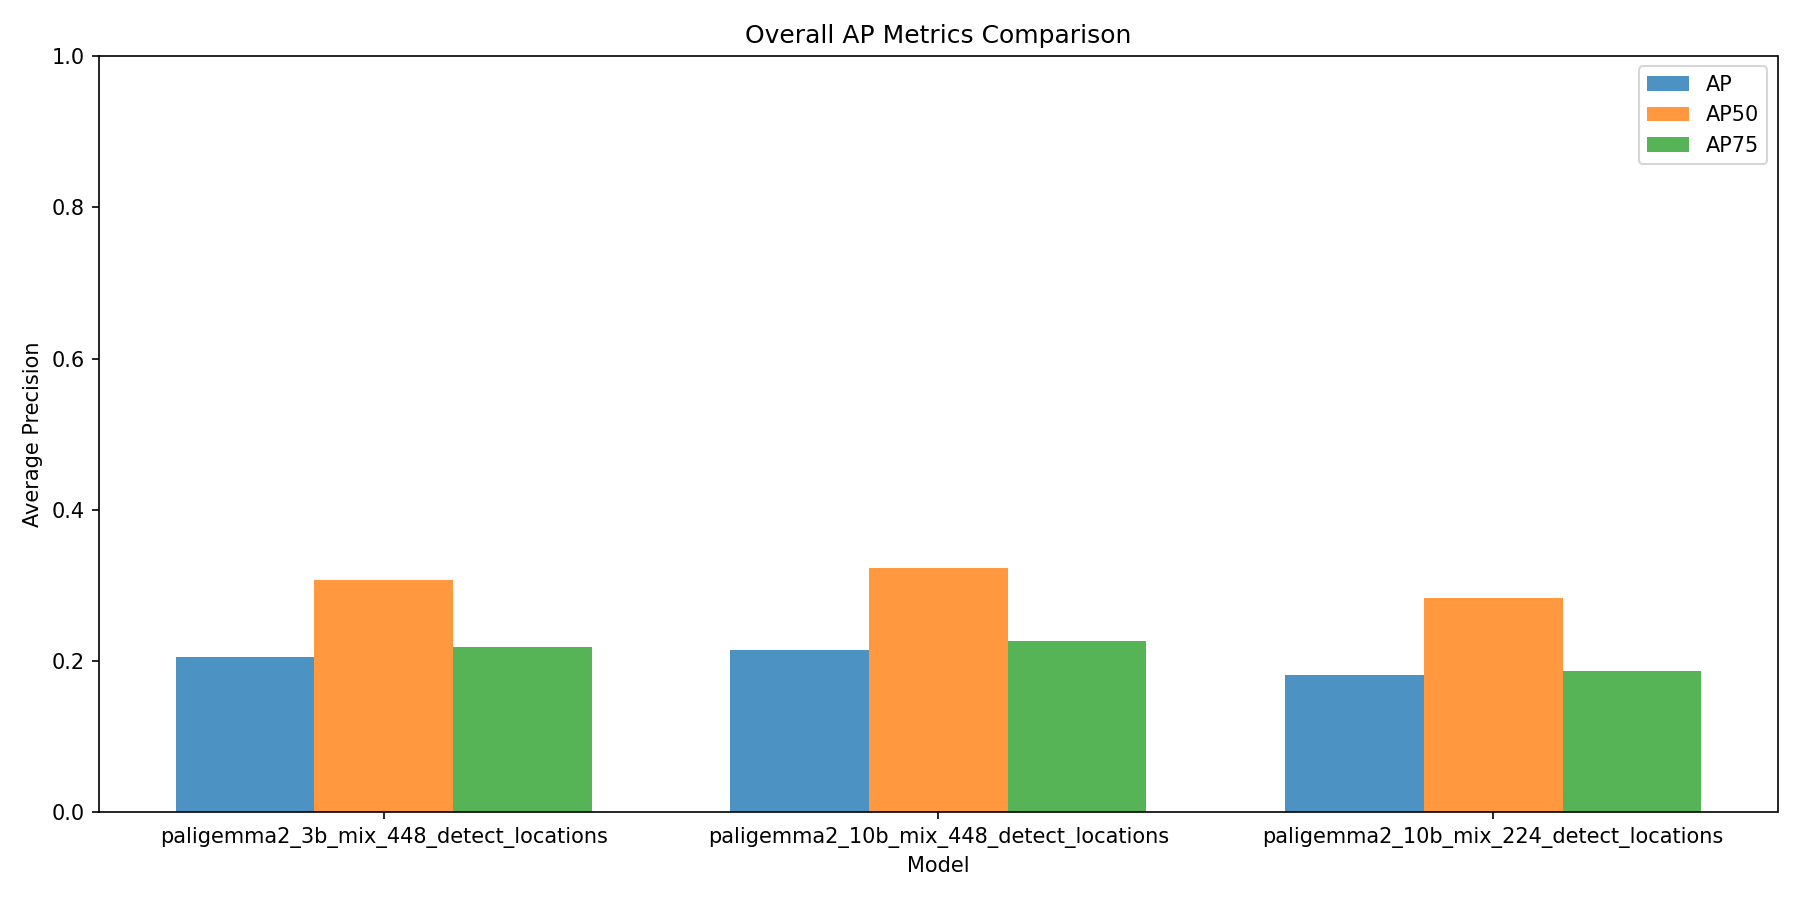
Overall Performance
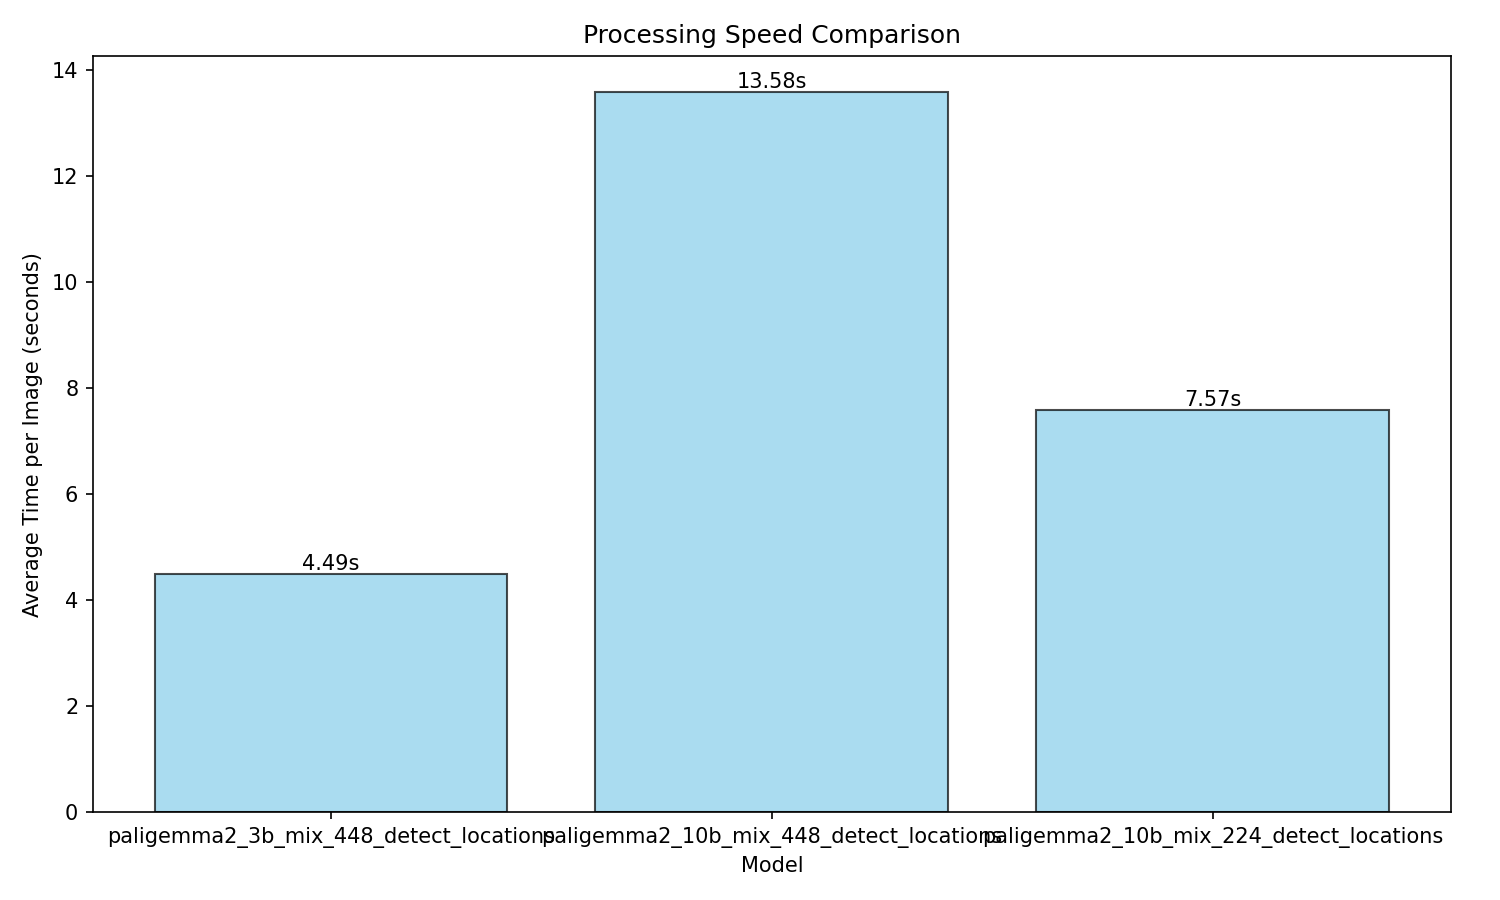
Processing Speed
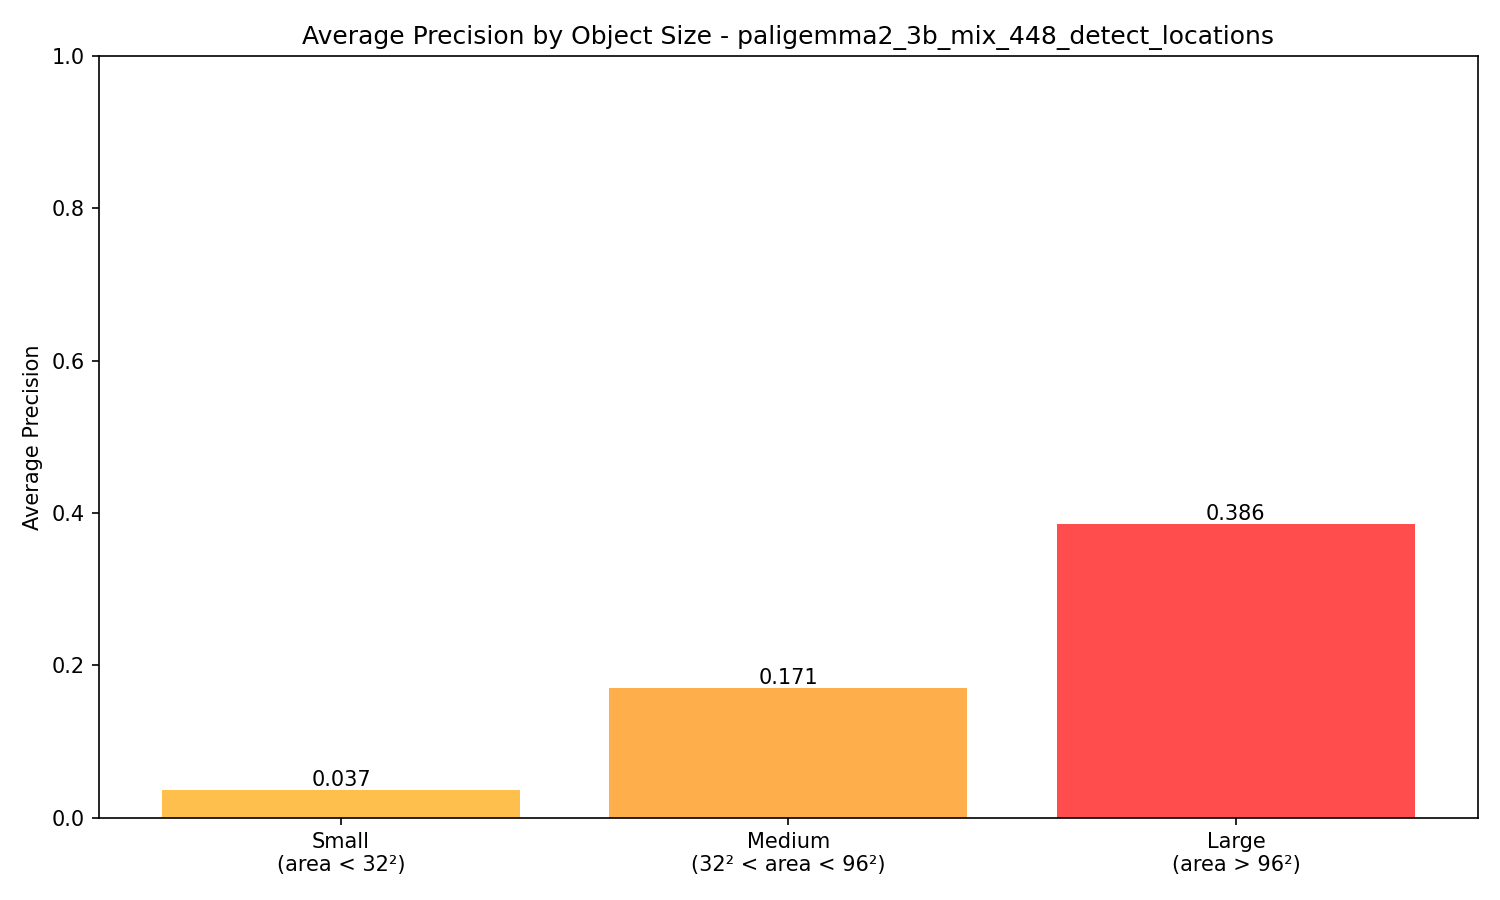
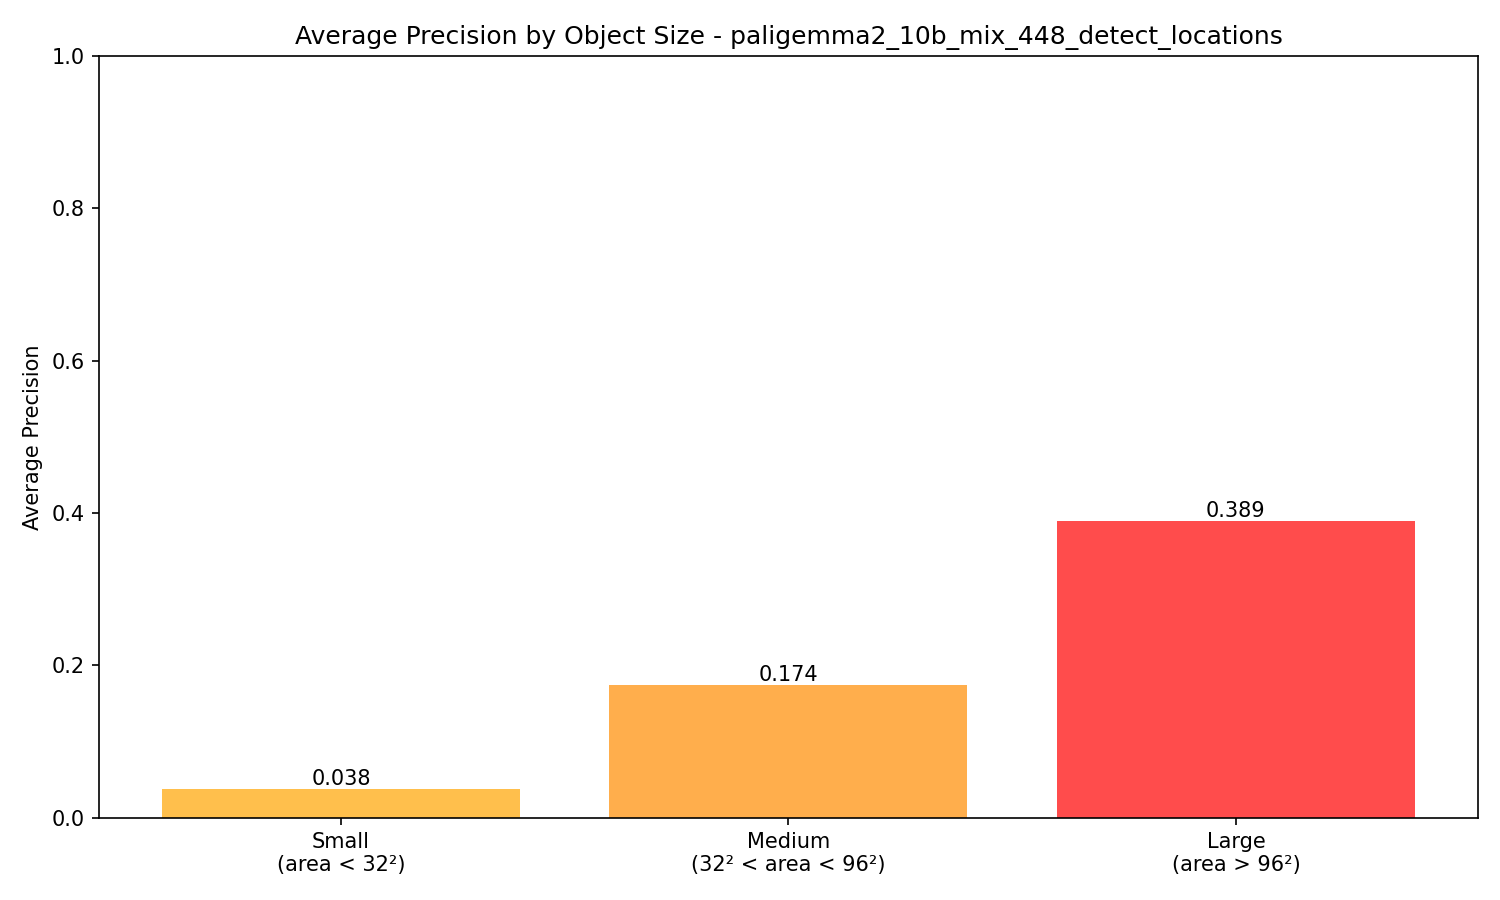
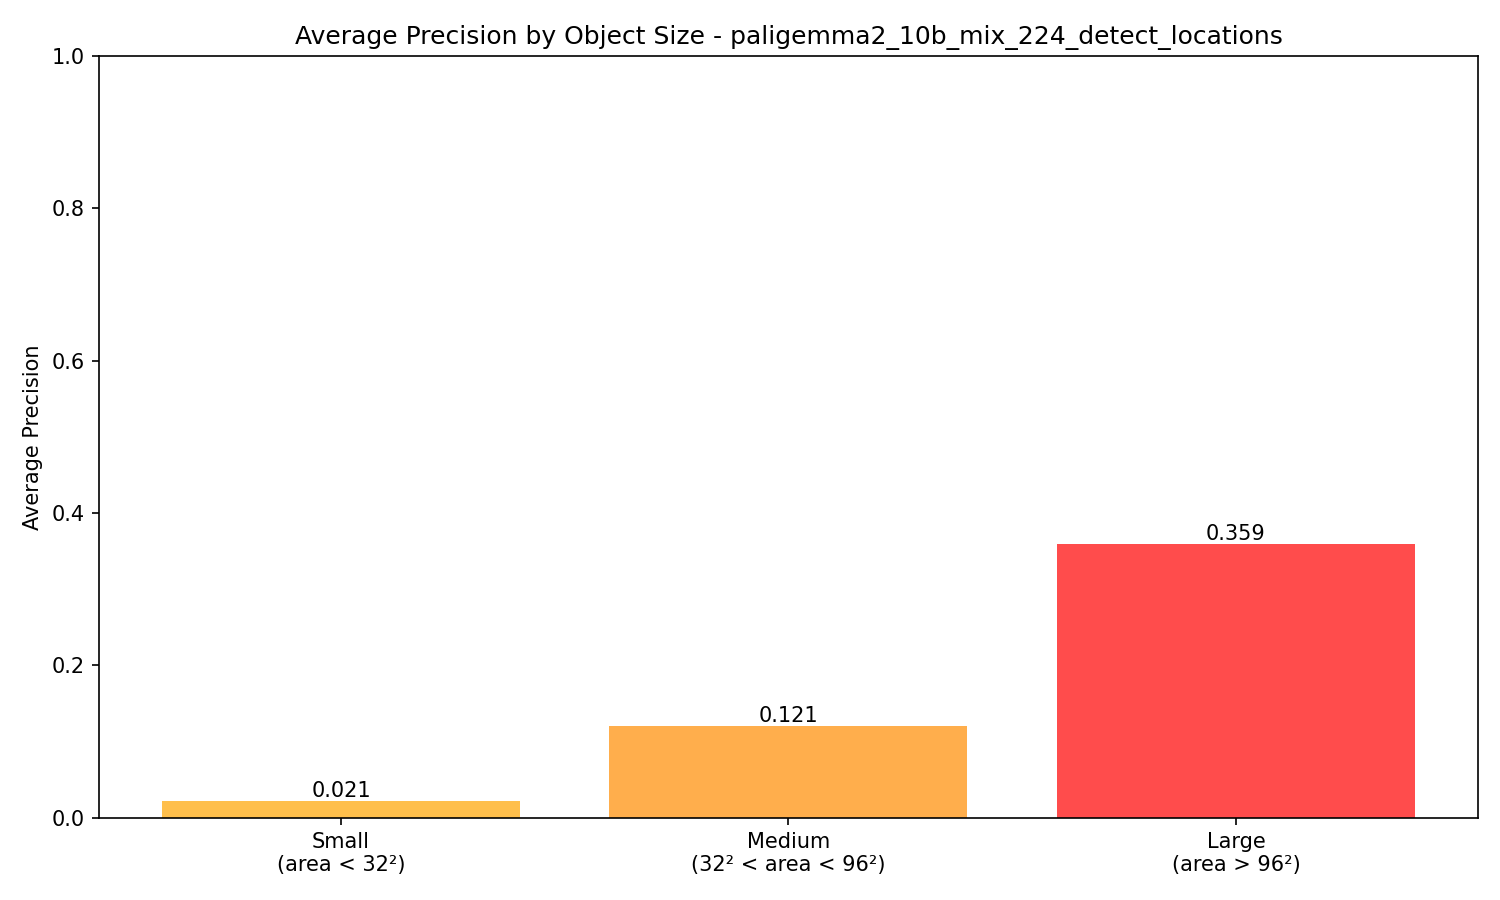
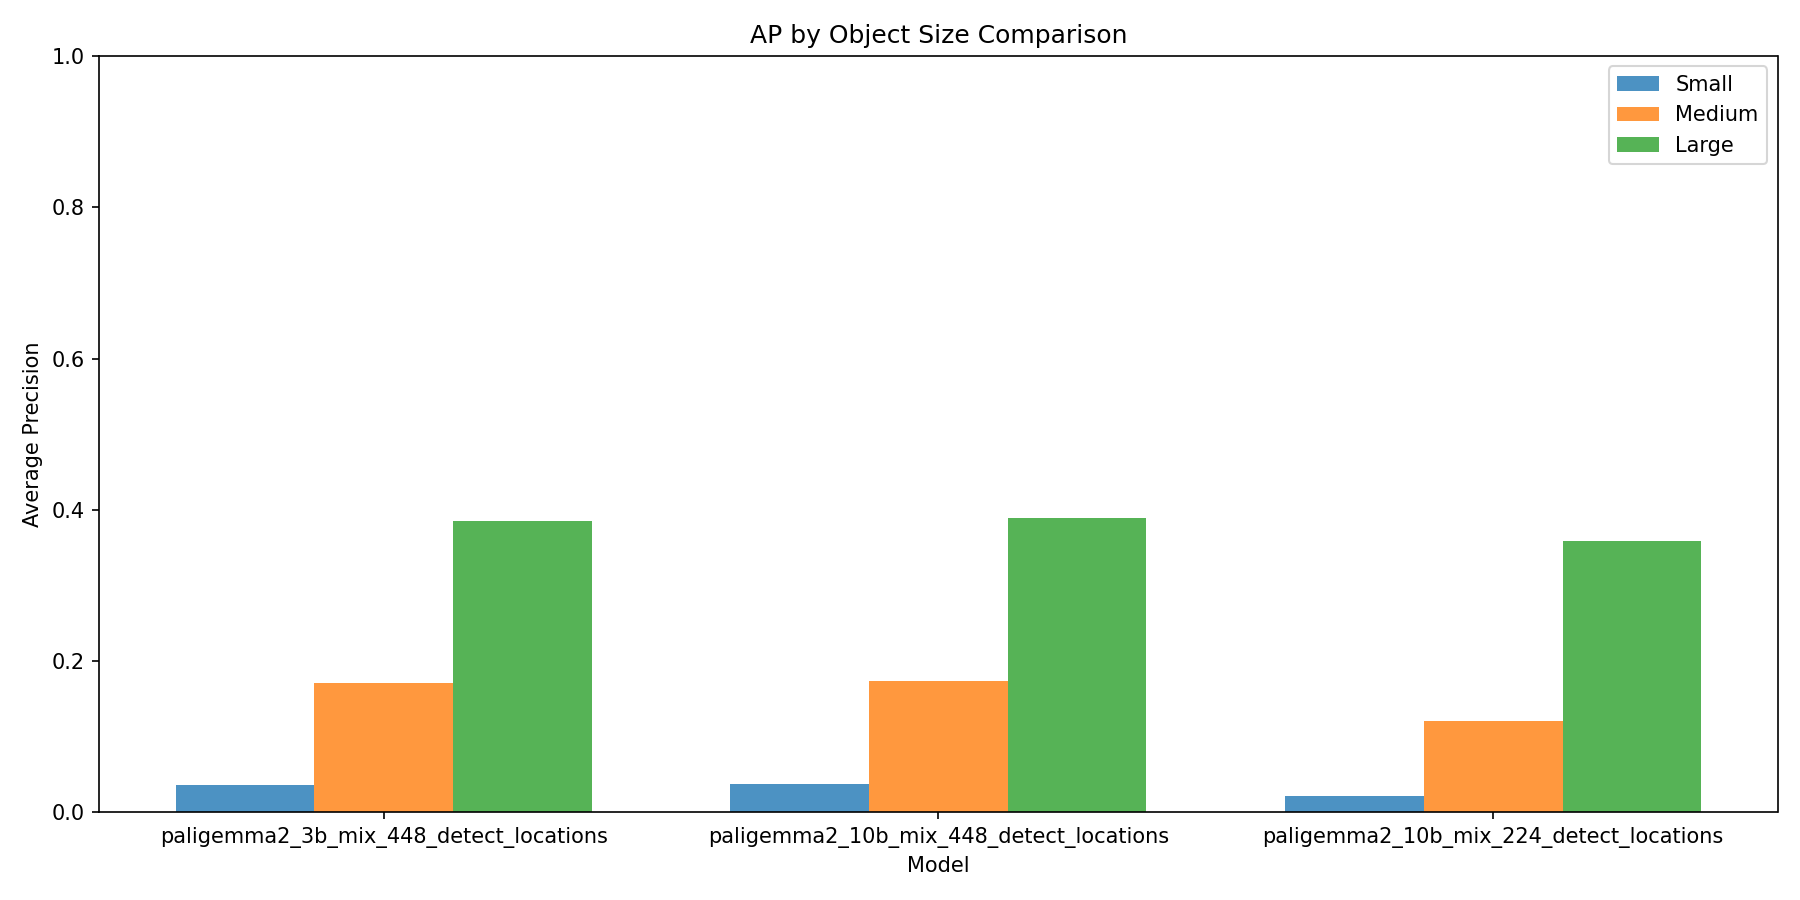
Performance by Object Size
Detailed Metrics Comparison
| Model | AP | AP50 | AP75 | Avg Time/Image |
|---|---|---|---|---|
| paligemma2_3b_mix_448_detect_locations | 0.205 | 0.307 | 0.218 | 4.49s |
| paligemma2_10b_mix_448_detect_locations | 0.214 | 0.323 | 0.227 | 13.58s |
| paligemma2_10b_mix_224_detect_locations | 0.182 | 0.283 | 0.187 | 7.57s |